AMOVA
Today I figured out that we could get the overall Wright’s Fixation index (Fst) from Analysis of molecular variance (AMOVA). Here is an example to do AMOVA and calculate the Fst.
library(pegas)
require(ape)
data(woodmouse)
d <- dist.dna(woodmouse)
g <- factor(c(rep("A", 7), rep("B", 8)))
p <- factor(c(rep(1, 3), rep(2, 4), rep(3, 4), rep(4, 4)))
amova(d ~ g/p, nperm = 100) # 2 levels
##
## Analysis of Molecular Variance
##
## Call: amova(formula = d ~ g/p, nperm = 100)
##
## SSD MSD df
## g 0.0000807865 8.078650e-05 1
## p 0.0001744503 8.722513e-05 2
## Error 0.0011043314 1.003938e-04 11
## Total 0.0013595681 9.711201e-05 14
##
## Variance components:
## sigma2 P.value
## g -8.3518e-07 0.3663
## p -3.5454e-06 0.6040
## Error 1.0039e-04
##
## Variance coefficients:
## a b c
## 3.714286 3.771429 7.466667m1 <- amova(d ~ g/p, nperm = 100)Based on the explanation on Wikipedia, Wright’s definition illustrates that Fst measures the amount of genetic variance that can be explained by population structure.
# overall Fst
Fst <- with(m1$varcomp, sum(sigma2[1:(length(sigma2)-1)])/sum(sigma2))
Fst
## [1] -0.04562482Here the two population structure g and p do not have significant variance, so almost close to 0. Still not sure why it can calculate some negative variance.
Pairwise Fst
Fst traditionally is calculated in Arlequin, but its input file is so difficult to prepare, so I still prefer doing it in R. After comparison, I found R package “StAMPP” has very close results with Arlequin.
# import genotype data and convert to allele frequecies
library(StAMPP)
library(lattice)

## Write a panel function (after examining 'args(panel.levelplot) to add text in the plot
myPanel <- function(x, y, z, ...) {
  panel.levelplot(x,y,z,...)
  panel.text(x, y, ifelse(x<y, round(z,2), ""), col = "red")
}

data(potato.mini, package="StAMPP")
potato.freq <- stamppConvert(potato.mini, "r")
# Calculate pairwise Fst values between each population
potato.fst <- stamppFst(potato.freq, 100, 95, 1)

## color borrowed from Arlequin
ColorRamp <- colorRampPalette(c("white", "steelblue1", "blue3"))
fst = potato.fst$Fsts
#fst = fst[nrow(fst):1,] # invert rows
tt = levelplot(t(fst),panel = myPanel, col.regions=ColorRamp,xlab="Population",ylab="Population",main="Pairwise Fst")
print(tt)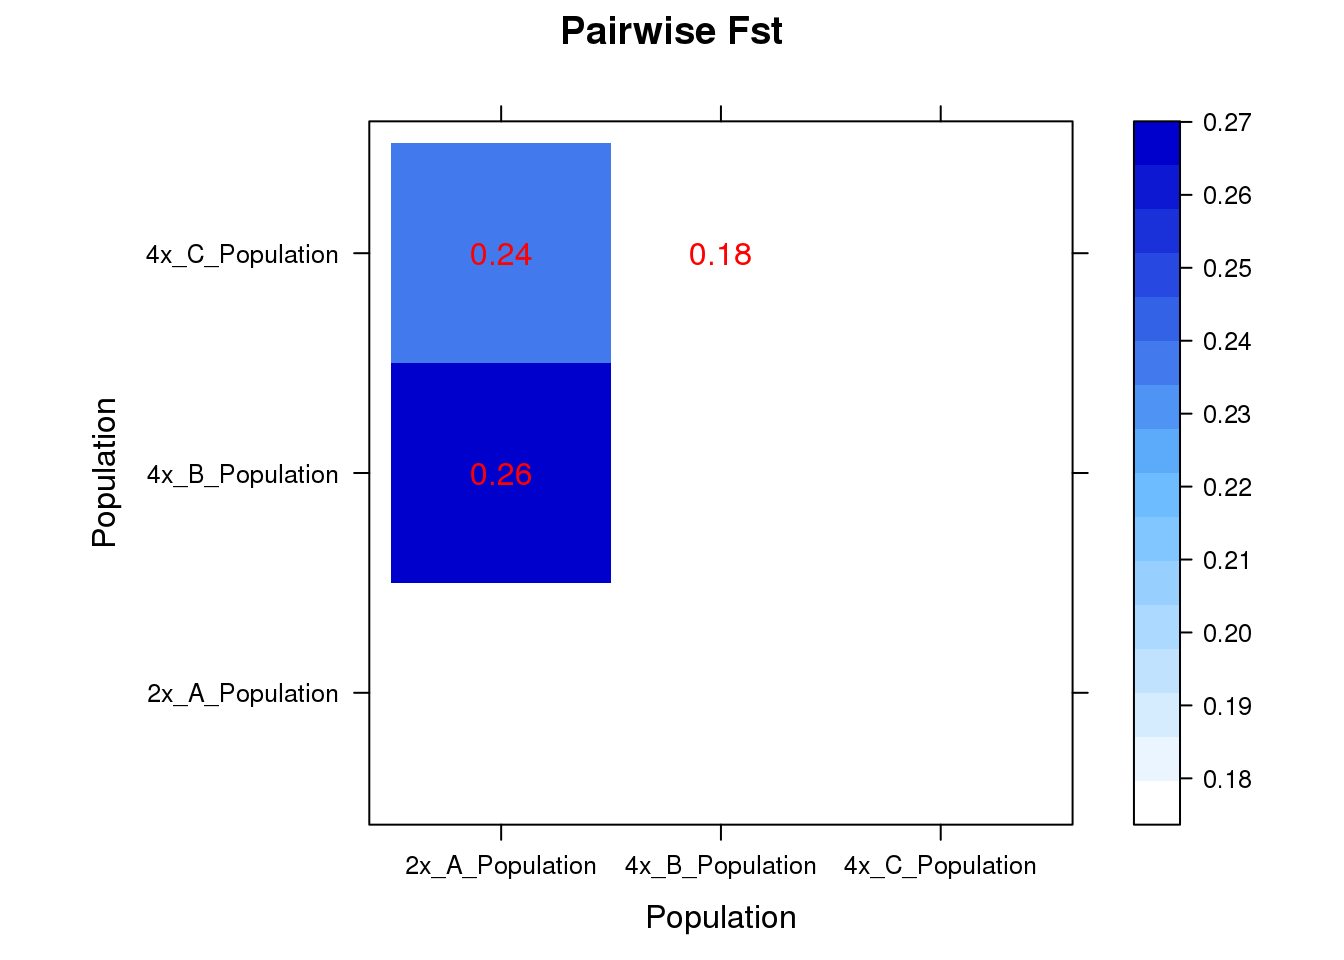
I work on allohexaploid wheat. Although it is a hexaploid, but it performs like a diploid, so coding of the SNP data is like AA, BB, AB.